Table of Contents
Intro: Project goal and outset
I created an image classification model that identifies car brands from a given picture without using the traditional datasets used such as Stanford Cars, VMMRDB, or any other dataset that is commonly used in this kind of research topics. In stead I created my own data using custom Python scripts and my own classifiers. In this series of posts I’ll guide you through all the steps it took to develop an end to end Data Science capstone project. By using your own dataset, you can train models on data that is representative for the region of the world you’re in, think of cars that are only homologated in specific regions of the world; brands that are not sold globally; or just preferences by buyers. All the code for this project is publicly available on GitHub and optimized for AMD GPU cards.
In this first part we’ll be talking about acquiring the data, do some high-level EDA, identify potential issues in the data and opportunities that would allow us to extend the project easily to classify the actual car model on top of the overarching brand. In a second part we’ll dive in and start with preprocessing the data and make the first set of neural networks that can help us achieve our final goal of brand classification. In the next phase I’ll pitch CNN against ViT architectures and in a final post we go over some typical visualizations that can be made to illustrate model performance.
You might think to yourself right now ‘cute, another vehicle classification blog’, don’t be fooled; the goal of this project was not to prove a CNN can be used to classify vehicles. The project was driven by a curiosity… Could I achieve a reliable model using my own dataset with no prior manual cleaning done by data-compilers and above all, could I do all of it on unsupported hardware. The latter was the biggest hurdle, but – *spoiler alert* – you can achieve good enough results with the right mindset, some creative tinkering and some basic problem solving skills.
Depending on the performance of the final classification model, we may have different applications for a project likes this. It could be used to help combat license plate fraud by cross-referencing registration data with observations made by smart ANPR-camera’s. This could even help prevent people from getting unjust fines – this would require exceptional well classification of course. There are also opportunities for commercial actors, such as used-car websites that could verify the selected brand by looking at the images and weed out rare, erroneous listings. The best outcome however would be to prove that you can get decent results with using recent data from car trading platforms. This allows us to continuously train this model by showing it the latest vehicles without requiring the expensive and labor-intensive annotation processes such as the ones applied to the Stanford Cars dataset.
Data acquisition
Even though there are some publicly available datasets, this project starts from a blank canvas. The public datasets all had a manual cleaning phase, are outdated or are irrelevant for my use case – often times it’s a combination of these. Take a look for instance at the well known Stanford Cars dataset. Before it was published, a manual cleaning phase was done, and it has become quite old – the dataset was released in 2015. Another example is CompCars, a dataset release by a Chinese university of Hong Kong, a much larger dataset, but one that already includes multiple types of annotations.
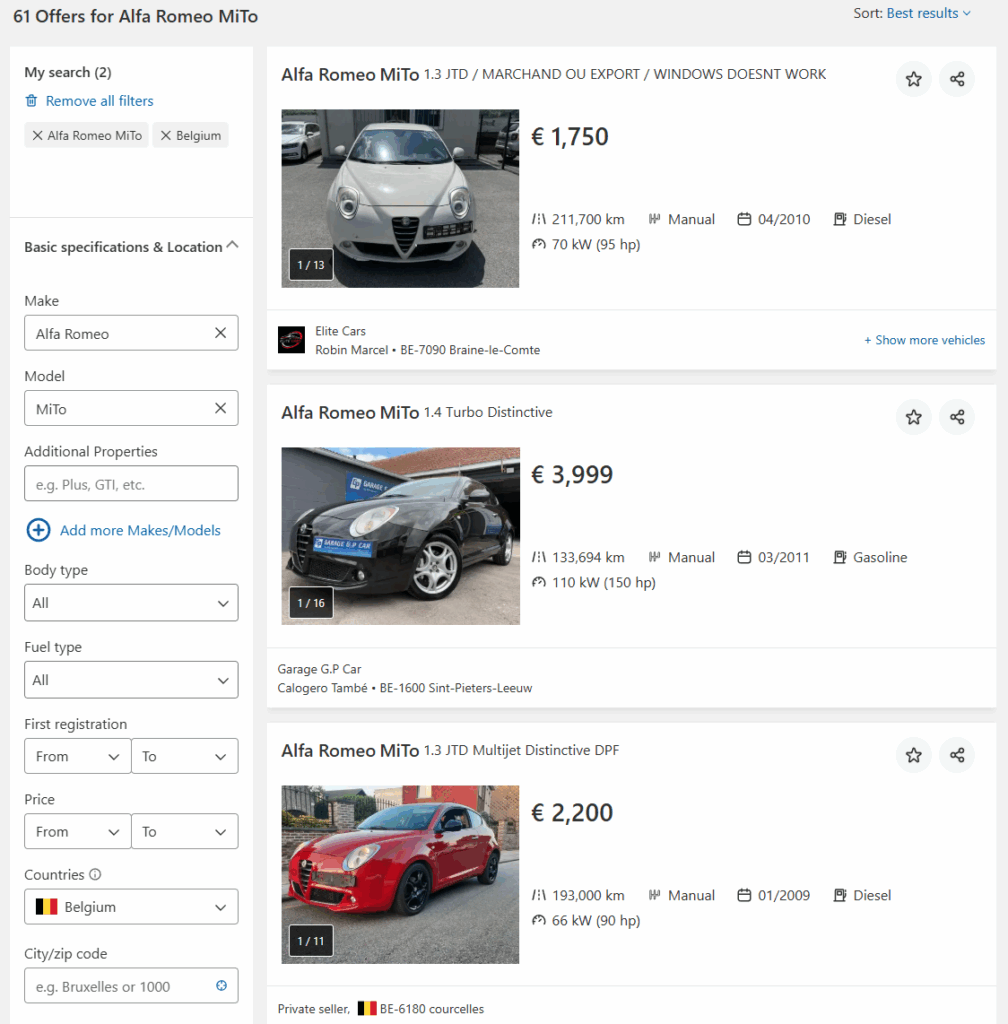
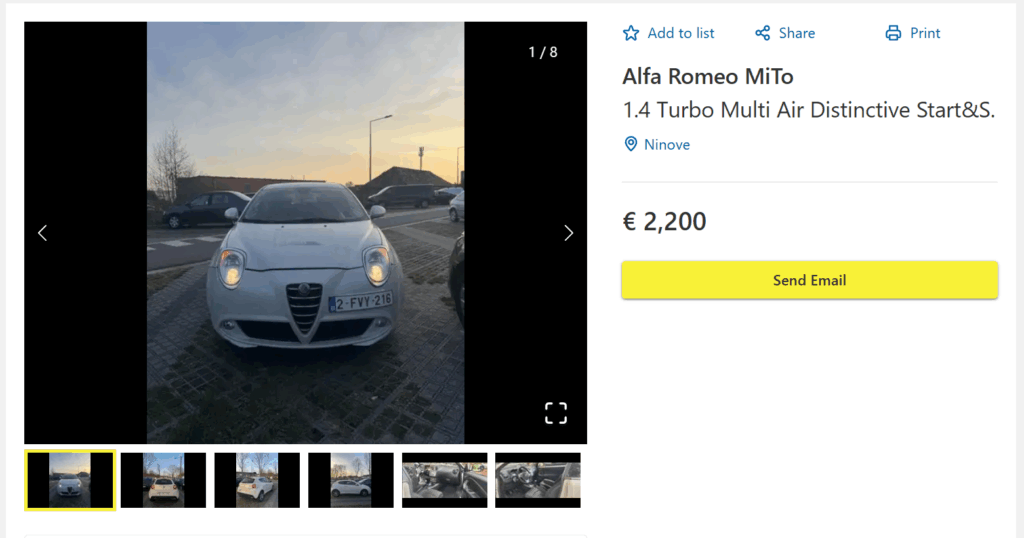
For my project I required another datasource, and I ended up using AutoScout24. This is a trading platform where private individuals and professional sellers can list cars for sale, this includes both used and new vehicles. This service is available in multiple countries, is well known and is extremely stable to collect data from. A combination of using the exposed API as well as regular webscraping allowed me to collect all the data I needed. I ended up scraping data for thirty brands – some popular brands such as Volkswagen and BMW. Some lesser known brands such as Lotus or Alpine and a whole bunch in between. I queried the data for four separate countries: Belgium, The Netherlands, France and Germany. The collected data included images in .webp format which were converted to .jpg while downloading and stored on a local drive. A MYSQL instance was used to keep track of the downloaded text data extracted from individual listings. This data describes the listing by providing a brand name, a model name, the year of the first registration, the type of chassis etc… this are handy features to have if we’d wish to extend this project into model identification.

In total this process took close to a month, an Intel NUC was used 24/7 to collect all the data. At the end of this phase I had over 15 million images which represented over 829.000 separate listings. Browsing through the listings would show you all kinds of mess in the data. The text-data is of a decently high quality to be used. The images however, would need to go through some preprocessing pipeline to weed out the unusable images – more on that later. There’s plenty of images on AutoScout that are not beneficial to identify a vehicle with, think of detailed pictures of paint scratches, registration and maintenance records, detailed pictures of mechanical components… What we’d like to end up with is some kind of classifying mechanism that would tell us whether or not an image is good to use or not. In Data Science we call this kind of problem a binary classification task; it splits up a population in one of two classes; in this case a usable and an unusable class.

EDA: Explorative Data Analysis
Before we can truly apply any kind of Data science techniques, we need to explore our data, how well is each brand covered, how well is this coverage spread in time (model years) and most importantly, how balanced are our car models? These questions are crucial to know, imagine 99% of your listings being Audi’s, then you could get 99% accuracy by classifying all of your cars as Audi’s. Knowing if these kind of imbalances are present in the dataset, will help us make the right decisions when it comes to setting up the training loop.
Brand balance

The bar charts above confirm a gut-feeling most of those enthusiastic about cars know already. There’s a massive imbalance between the brands. Large manufacturers such as Volkswagen and Mercedes have close to 100.000 listings each in my dataset. Smaller brands such as Subaru, Lotus or Alpine only have a handful of cars listed for sale. We can dive in deeper into this imbalance by making a treemap. That is a visualization where we can also add a hierarchical element to it. For example all models a certain brand produced. If cars are not your thing, think of a chart that visualizes all kinds of pets. The first level in this hierarchy would for instance be Cats, Dogs, Fish, Reptiles, Birds, etc. The box for dogs could be subdivided further by the different breeds (e.g. Golden Retriever, Labrador, German Shepherd, etc…).

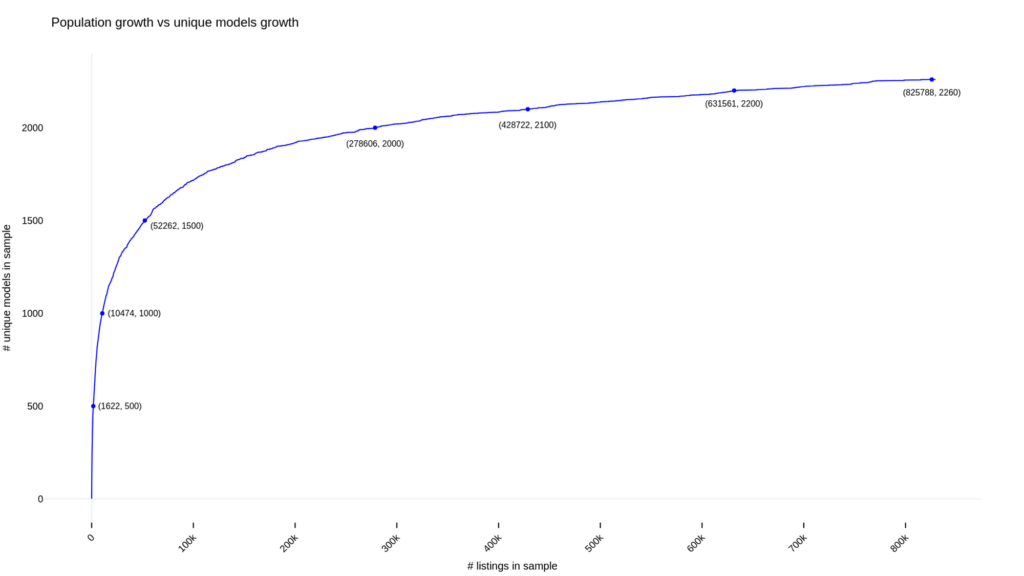
This treemap further shows us the imbalance, it teaches us that the VW Golf, has a larger volume than all of the models of Alfa Romeo, Honda, Lexus, Subaru, Lotus and Alpine combined – ouch! Let’s also look a simulated draw of all of our listings. This draw throws each listing on a pile and takes one from it, it notes down the model and which draw number it was. What we ideally want to see in a plot like this is a sharp early rise and a long flat tail. This sharp early rise shows us that there are many unique brand-model combinations being drawn early. The long horizontal tail means that after a while no new brand-model combinations are found. From the treemap above we already know that that is very unlikely. Firstly there’s the brand-imbalance. Secondly there are some very rare cars for each brand. Let’s see just how bad it is.

It is actually not all too shabby; we see in our plot that we have a total of 2260 unique brand-model combinations (in reality it is even higher, I’ll talk about it later in this post). The first 500 unique models are already found after 1622 draws. If we want to double the amount of unique models, we’d need to perform over 10.000 draws. The curve continues and by the time we hit 278.606 draws, we already have 2000 unique brand-model combinations. To get the remaining 260 brand-model combos we need to do well over an additional half a million draws. So as expected, the tail is not very flat, but it is clearly topping out. That is just how the data is, imbalanced. If we want to make this Carmageddon project a success, we’ll really need to think of a way of dealing with this – for now, let’s park this idea in the back of our mind, we’ll get back to it when we talk about splitting our dataset into a training, test and validation set in a later part of this series.
Time balance

The data was collected in 2024, with the first few days of 2025 being included. It shows the absolute number of vehicles for sale per year of it’s first registration. There are two caveats here, but there’s no way around them. The year of first registration is not the same as the model year. It can be skewed by ‘day registrations,’ when a dealer or manufacturer registers a car for just one day without it being driven. This boosts sales figures or allows the car to be sold under older, more lenient standards before new regulations take effect—making an older model appear to have a more recent date.
It could also go the other way – a press-car being handed out to automotive journalists may already be registered even when it’s not yet for sale. We won’t worry too much about this, the goal is to identify brands – if all goes well, the neural network will pick up on design language to classify brands and the time-factor would play a small role here. We can always check in our final phase how accurate and confident the classification model is for older vehicles.
With all of that said, the plot above shows us nothing surprising, there are a few really old cars – some well over a century, but they are dwarfed in numbers by much more recent vehicles. Not surprising as old cars are often economically not worth repairing and end up in scrapyards (Boo!). Since AutoScout also shows new vehicles we can see a great deal of ‘young’ vehicles for sale too.
Here be dragons
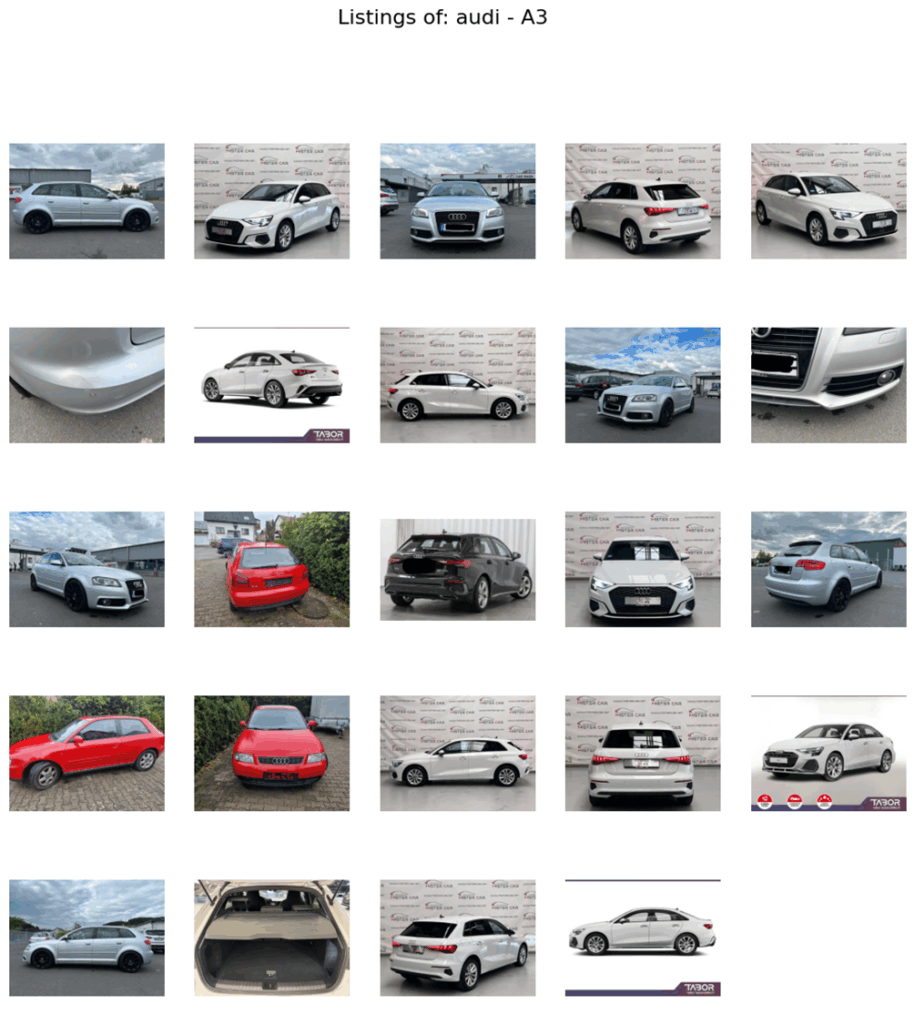
So we have collected our data, checked some basic distributions can we now get straight to modelling? Well… no. EDA showed us just how unequal our distributions are (both when it comes to brand representation as well as the years). Our EDA did never really include an analysis of the images themselves. Let’s look at some pictures of the popular Audi A3:

First, the model name ‘A3’ does not cover body styles: we see hatchback, sedan, and convertible versions. Second, both older and newer generations share the same name; to distinguish them we’ll need the year of first registration—imperfect, but the best available. Together, these findings show that our 2,260 unique brand-model combinations actually hide far more variety than previously thought. Third, as noted earlier, some images are useless—interior parts or detailed shots of subcomponents add no value, these will have to go.
Part 1: conclusions
Let’s recapitulate what we found out so far :
- There’s an unbalance in our data: some brands are overrepresented, others are barely visible.
- Older cars are not all that visible in our dataset – not that surprising.
- Our data contains garbage; there are useless pictures in there of car details, interiors, documents, or even random placeholders/dealer images.
- If we’d want to extend this project to identify models on top of the actual brands, we’d need to find a way uncover just how much variety is hiding underneath the current 2260 unique brand-model combinations (different body styles and model years). We’ll approach this problem theoretically at the end of this series.
In the next part of this blog series I’ll guide you through the technical choices I made to overcome these issues with a simple deep learning model.
Meet me Frédéric, the ex-twenty-something petrolhead navigating life in the little town of Leuven (and beyond!) while hurtling through space on this beautiful rock we call home. By day, I work magic as a coffee-into-code convertor, but when the weekend rolls around, you'll find me scaling walls (until gravity inevitably says `nope`), travelling into wonderland, and generally living life in carpe-diem-mode. Don't be surprised if you spot me snapping pics along the way - there's always a trusty camera somewhere! So buckle up, put the pedal to the metal, and come along for the ride with me!
image sources
- {EF86C61F-6FFD-42C1-B64F-6CEA2F0798DA}: © https://blog.photowski.be | All Rights Reserved
- {ACDCCE96-81EC-4C70-A35D-CAC4946012BB}: © https://blog.photowski.be | All Rights Reserved
- image: © https://blog.photowski.be | All Rights Reserved
- image: © https://blog.photowski.be | All Rights Reserved
- image: © https://blog.photowski.be | All Rights Reserved
- image: © https://blog.photowski.be | All Rights Reserved
- image: © https://blog.photowski.be | All Rights Reserved
